Applies To: ThreatSync
Some of the features described in this topic are only available to participants in the ThreatSync Beta program. If a feature described in this topic is not available in your version of WatchGuard Cloud, it is a beta-only feature.
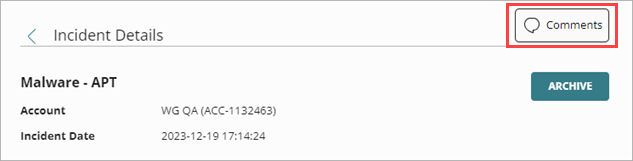
The Incident Details page shows detailed information about a specific threat. You can view the incident name, associated account, incident date, and additional sections that provide details specific to the type of incident.
You can perform actions on the selected incident in various sections on the Incident Details page. For more information, go to Perform Actions on Incidents and Endpoints.
To open the Incident Details page:
- Select Monitor > Threats.
The Incidents page opens. - Click an incident.
The Incident Details page opens.
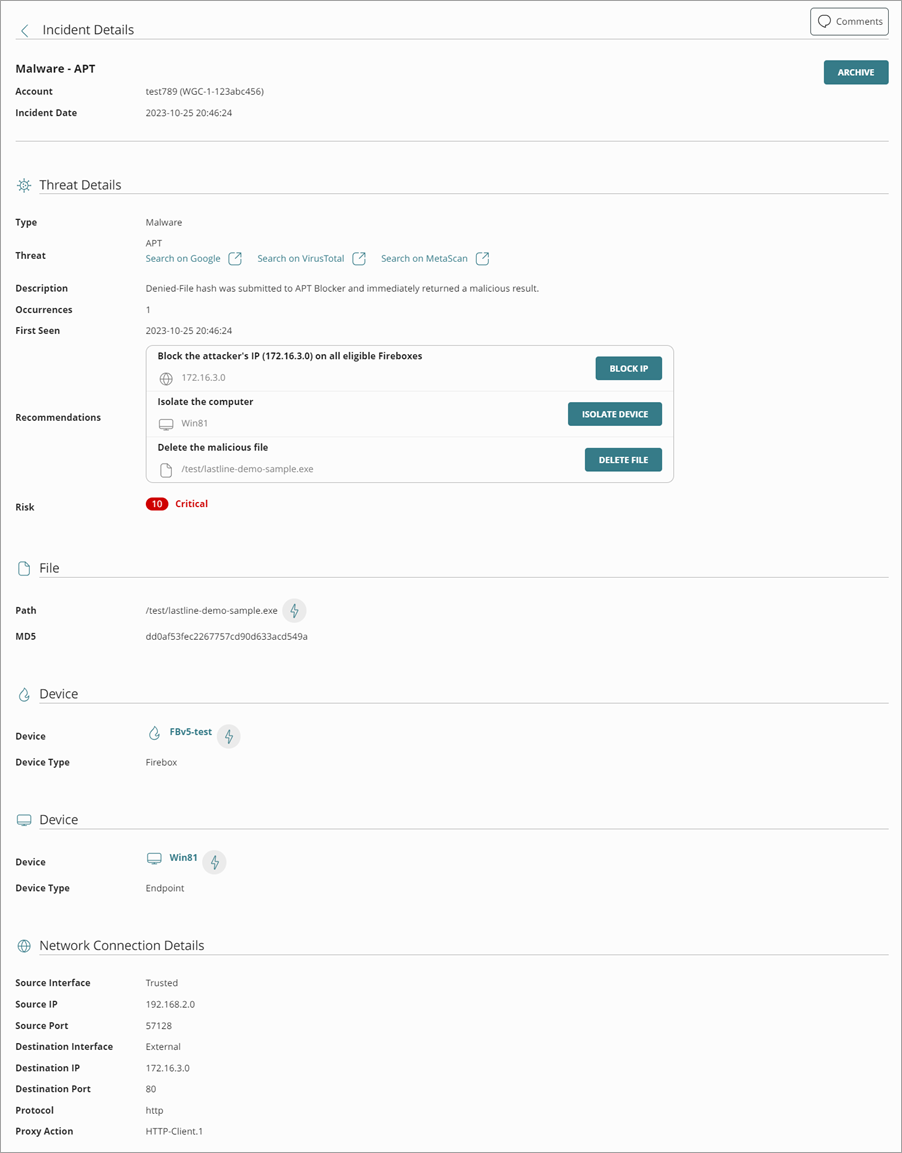
The sections shown on the Incident Details page vary by incident type and can include:
- Threat Details
- File
- Malicious URL
- Program or Compromised Program
- Device
- Network Connection Details
- Rogue Access Point
- Evil Twin
- Detected By
- Other Details
- Threat Activity Graph
- Comments
- Incident Audit Log
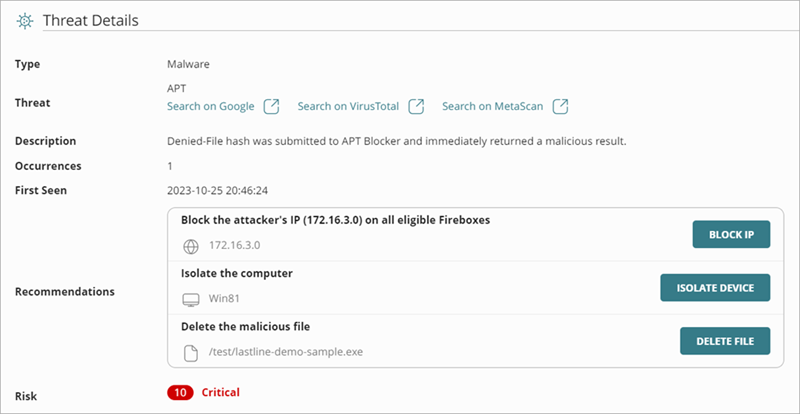
Threat Details
The Threat Details section includes different details specific to the incident type selected.
The details in this section can include:
- Type — The incident type:
- Advanced Security Policy — The execution of malicious scripts and unknown programs that use advanced infection techniques.
- Exploit — Attacks that try to inject malicious code to exploit vulnerable processes.
- Intrusion Attempt — A security event where an intruder tries to gain unauthorized access to a system.
- IOA — Indicators of Attack (IOAs) are indicators that are highly likely to be an attack.
- Malicious URL — A URL created to distribute malware, such as ransomware.
- Malicious IP — An IP address associated with malicious activity.
- Malware — Malicious software designed to damage, disrupt, and gain unauthorized access to computer systems.
- PUP — Potentially Unwanted Programs (PUPs) that might install when other software installs on a computer.
- Virus — Malicious code that enters computer systems.
- Unknown Program — Program was blocked because it has not yet been classified by WatchGuard Endpoint Security.
- Malicious Access Point — An unauthorized wireless access point connected to your network or operating in your airspace.
- Threat — The name of the threat. For some incident types, you can click a link to search Google or a third-party website for more information about the threat.
- Description — The description of the incident.
- Occurrences — The number of occurrences of the incident.
- First Seen — The date and time the incident was first detected.
- Last Seen — The date and time the incident was last detected.
- Intrusion Type — The type of intrusion.
- Automatic Response — The automatic action taken by the Firebox, access point, or endpoint device in response to the threat.
- Allowed (Audit Mode) — Incident detected, but because the device is in Audit mode, no action was taken.
- Connection Blocked — Connection blocked.
- Process Blocked — Process blocked by an endpoint device.
- Device Isolated — Communication with device is blocked.
- File Deleted — File was classified as malware and deleted.
- IP Blocked — Network connections to and from this IP address are blocked.
- Process Killed — Process ended by an endpoint device.
- Detected — Incident detected but no action was taken.
- Recommendations — Suggested remediation actions to perform on the threat. Click a button to perform a recommended action or stop a previous action. For more information, go to Perform Actions on Incidents and Endpoints.
Recommendations for an incident on the Incident Details page determine what actions are available in the Actions drop-down list on the Incidents page. For example, if the recommended action for an incident is to isolate a device, the Isolate/Stop isolating device option is enabled in the Actions drop-down list.
- Risk — Risk level assigned to the incident. For more information, go to ThreatSync Risk Levels and Scores.
- Threat Activity Graph — If an Indicator of Attack (IOA) has a graph associated with it, click the Threat Activity Graph button to open the graph.
- Other Details — Additional information related to the incident.
You can perform recommended actions in the Threat Details section, or stop a previously selected action. For more information, go to Perform Actions on Incidents and Endpoints.
File
The File section shows details about the flagged file, and can include the file name and file path.
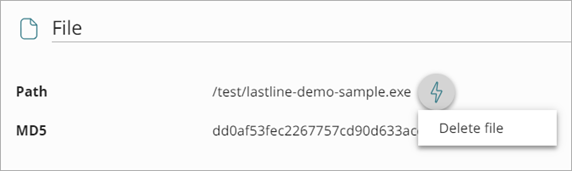
You can perform actions directly from the File section. Click the lightning bolt ![]() to open the action menu. For more information, go to Perform Actions on Incidents and Endpoints.
to open the action menu. For more information, go to Perform Actions on Incidents and Endpoints.
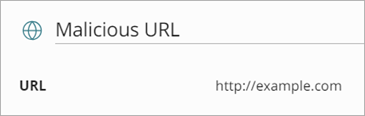
Malicious URL
The Malicious URL section shows the URL of a malicious website.
Program or Compromised Program
The Program or Compromised Program section shows the path and name of the program file associated with the incident, and the MD5 value for the file.
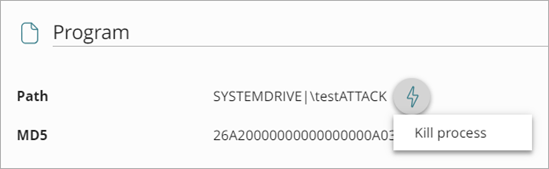
You can perform actions directly from the Program or Compromised Program section. Click the lightning bolt ![]() to open the action menu. For more information, go to Perform Actions on Incidents and Endpoints.
to open the action menu. For more information, go to Perform Actions on Incidents and Endpoints.
Device
The Device section shows details about the devices affected by the incident.
If the threat affects both a Firebox and an endpoint device, the Incident Details page can include more than one Device section for the same incident.
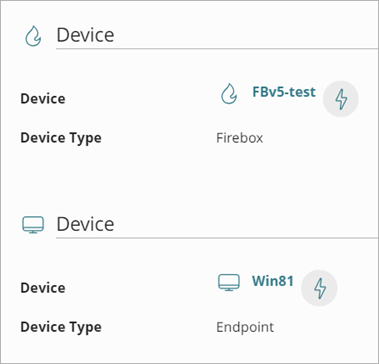
The Device section includes these details:
- Device — Name of the device.
- Device Type — Type of device, either Firebox, Endpoint, or Access Point.
- IP Address — IP address of an endpoint device.
You can perform actions directly from the Device section. Click the lightning bolt ![]() to open the action menu. For more information, go to Perform Actions on Incidents and Endpoints.
to open the action menu. For more information, go to Perform Actions on Incidents and Endpoints.
Network Connection Details
The Network Connection Details section shows details about the network connection related to the incident, and enables you to block an IP address on eligible Fireboxes.
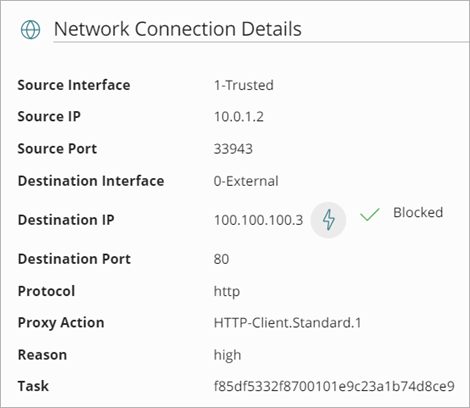
The Network Connection Details section varies by incident type and can include this information:
- Source Interface — Name of the interface that was the source of the traffic.
- Source IP — IP address that was the source of the traffic. To block an external IP address, click the lightning bolt
 , and select Block IP on All Eligible Fireboxes.
 - Source Port — Number of the port that was the source of the traffic.
- Destination Interface — Name of the interface that was the destination of the traffic.
- Destination IP — IP address that was the destination of the traffic.
- Destination Port — Number of the port that was the destination of the traffic.
- Protocol — Protocol used for the connection.
- Source — Source IP address was a botnet.
- Message — Firebox log message.
- Proxy Action — The profile (settings, sources, or destinations) for the proxy.
- Reason — Incident risk level.
- Task — The task UUID.
You can perform actions directly from the Network Connection Details section. Click the lightning bolt ![]() to open the action menu. For more information, go to Perform Actions on Incidents and Endpoints.
to open the action menu. For more information, go to Perform Actions on Incidents and Endpoints.
Rogue Access Point
The Rogue Access Points section shows details about a device detected as a Malicious Access Point. A Rogue access point is an unauthorized access point that is physically connected to your wired network and broadcasts wireless SSIDs your clients might connect to instead of your legitimate access point SSIDs.
- Use the location information in the Detected By section to locate the malicious access point and disconnect it from your network.
- You can also disable switch ports or use MAC address blocking on your network switch to isolate the Rogue access point from the network if you cannot find the device.
ThreatSync currently only detects and reports on wireless threats. ThreatSync does not remediate wireless threat incidents to prevent connections to the malicious access point or disconnect wireless clients that have already associated to a malicious access point.
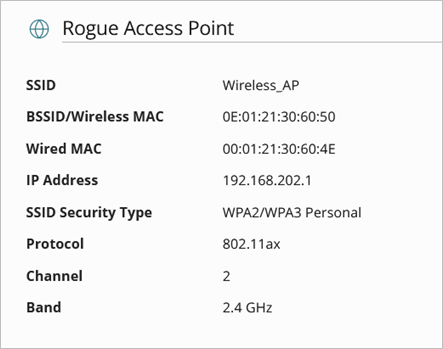
- SSID — The SSID broadcast by the Rogue access point.
- BSSID/Wireless MAC — The BSSID/MAC address of the wireless interface of the Rogue access point.
- Wired MAC — The MAC address of the wired interface of the Rogue access point.
- IP Address — The IP address of the Rogue access point.
- SSID Security Type — The security type of the SSID broadcast by the Rogue access point, such as Open or WPA3 Personal.
- Protocol — The wireless protocol used by the Rogue access point, such as 802.11ac.
- Channel — The wireless channel used by the Rogue access point.
- Band — The wireless band used the Rogue access point, such as 2.4 GHz or 5 GHz.
Evil Twin
The Evil Twin section shows details about a device detected as a Malicious Access Point. An Evil Twin is a nearby access point operating in your airspace that broadcasts the same SSID name as your managed access points to appear as a legitimate access point on your network. Your clients might connect to the Evil Twin access point SSID instead of your legitimate access point SSID.
- Alert your users to the existence of the Evil Twin access point. Wireless clients might connect to the Evil Twin access point and communicate vulnerable data.
- Use the location information in the Detected By section to find the approximate location of the malicious access point.
ThreatSync currently only detects and reports on wireless threats. ThreatSync does not remediate wireless threat incidents to prevent connections to the malicious access point or disconnect wireless clients that have already associated to a malicious access point.
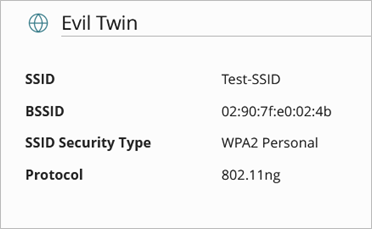
- SSID — The SSID broadcast by the Evil Twin access point. This SSID is identical to an SSID broadcast by your legitimate managed access points.
- BSSID — The BSSID MAC address of the wireless interface of the Evil Twin access point.
- SSID Security Type — The security type of the SSID broadcast by the Evil Twin access point, such as Open or WPA2.
- Protocol — The wireless protocol used by the Evil Twin access point, such as 802.11ac.
Detected By
The Detected By section shows details about the WatchGuard access point that detected a Malicious Access Point incident (Rogue Access Point or Evil Twin).
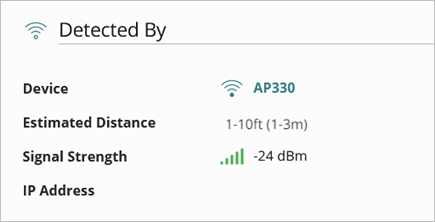
- Device — The name of the WatchGuard device that detected the malicious access point.
- Estimated Distance — The estimated distance of the detected malicious access point measured in feet and meters. This value is based on the detected signal strength of the device. The RSSI value corresponds to these approximate distances:
- RSSI between 0 dBm to -39 dBm = 1 to 10 feet, 1 to 3 meters
- RSSI between -40 dBm and -50 dBm = 10 to 20 feet, 3 to 6 meters
- RSSI between -50 dBm and -55 dBm = 15 to 25 feet, 4 to 8 meters
- RSSI between -55 dBm and -60 dBm = 25 to 35 feet, 7 to 10 meters
- RSSI between -60 dBm and -65 dBm = 30 to 45 feet, 9 to 14 meters
- RSSI between -65 dBm and -70 dBm = 40 to 60 feet, 12 to 18 meters
- RSSI between -70 dBm and -75 dBm = 55 to 80 feet, 16 to 25 meters
- Below -75 dBm = Greater than 70 feet, Greater than 21 meters
- Signal Strength — The RSSI (Received Signal Strength Indicator) of the malicious access point measured in decibels per milliwatt (dBm).
- IP Address — The IP address of the WatchGuard device that detected the malicious access point.
Other Details
Indicators of Attack incidents, the Other Details text box provides data in JSON format that includes fields relevant to the event that led to the generation of the IOA.
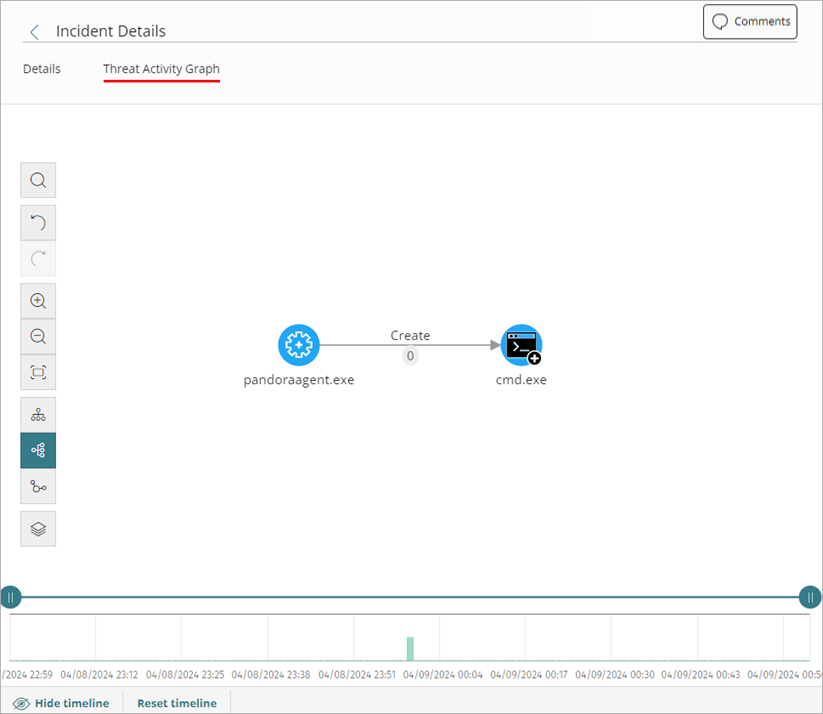
Threat Activity Graph
For Indicators of Attack (IOA) incidents, a Threat Activity Graph tab appears at the top of the Incident Details page. The threat activity graph is an interactive diagram of the sequence of events that led to the generation of the IOA. Incident Responders can use the graph to help identify the root cause of an attack.
If an IOA has a graph associated with it, select the Threat Activity Graph tab on the Incident Details page to open the graph.
For more information about Threat Activity Graphs, go to About Threat Activity Graphs in ThreatSync.
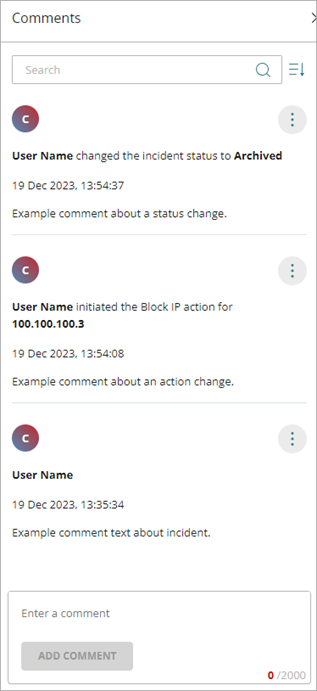
Comments
When you review and respond to incidents, you can add comments for other Incident Responders to view and respond to. Comments appear in the Comments pane of the Incident Details page and enable responders to communicate and document incident activity.
When you change the status of or perform an action on an incident, a dialog box opens with a text box to add an optional comment. These comments also appear in the Comments pane. For more information, go to Perform Actions on Incidents and Endpoints and Archive or Change the Status of Incidents.
The Comments pane is minimized by default. Click Comments on the Incident Details page to open the Comments pane.
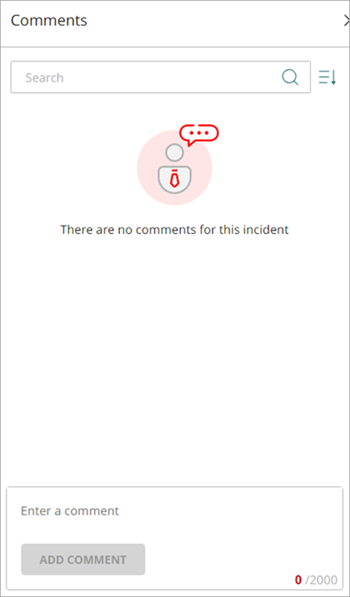
The Comments pane includes:
- Search — Type text in the search box to filter comments by user name or keyword.
- Sort — Click
 to sort comments by date. Most recent comments appear first, by default.
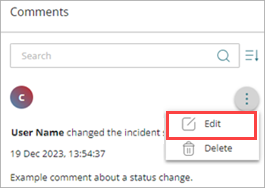
 - Comments — View the comments for the incident. Click
 to edit or delete the comment. Comments include this information:
- Commenter user name
- Date and time of comment
- Status change or action performed, if any
- Enter a Comment — Enter new comments in this text box.
Add a Comment to an Incident
You can add comments directly to an incident on the Incident Details page. You can also add comments to an incident when you perform an action or change the incident status. For more information, go to Perform Actions on Incidents and Endpoints and Archive or Change the Status of Incidents.
To add a comment to an incident:
- Select Monitor > Threats > Incidents.
The Incidents page opens. - Click an incident.
The Incident Details page opens. - Click Comments.
The Comments pane opens.
- In the Enter a Comment text box, type your comment.
- Click Add Comment.
The new comment appears in the Comments pane.
Edit a Comment
You can edit your own comments from the Comments pane on the Incident Details page.
You cannot edit comments made by other users.
To edit a comment in an incident:
- Select Monitor > Threats > Incidents.
The Incidents page opens. - Click an incident.
The Incident Details page opens. - Click Comments.
The Comments pane opens. - Find the comment you want to edit and click .
- From the drop-down list, select Edit.
- In the text box, enter your changes.
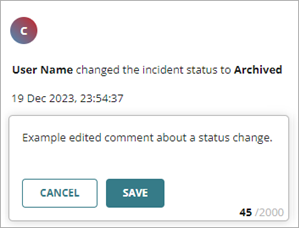
- Click Save.
Incident Audit Log
The audit log appears in the Audit Log pane of the Incident Details page and enables you to view and search all actions and events associated with the incident.
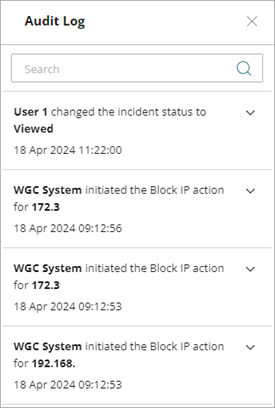
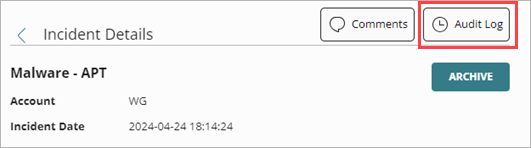
The Incident Audit Log pane is minimized by default. Click Audit Log on the Incident Details page to open the Audit Log pane.
The Audit Log pane includes:
- Audit Log List — View the audit log list for the incident. Every action associated with the incident appears in the list.
- Search — Enter text in the search box to filter the list results.
Audit Log Details
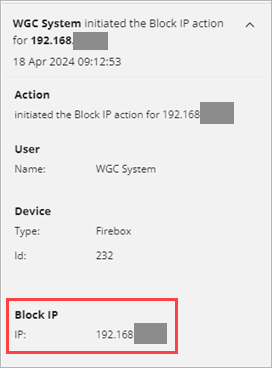
Click any entry in the Audit Log pane to open and view its details:
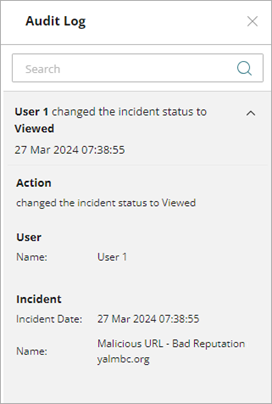
Details for a log entry can include:
- Action — A description of the event or action that triggered the log.
- User — The user who performed the event or action.
- Device — The device type and device ID of where the action was performed.
- Incident — The date and time of the event or action.
- Action Name — The name of the action performed. For example, Block IP.
For more information about ThreatSync logging, go to ThreatSync Logging.
Perform Actions on Incidents and Endpoints